XDebug是一个开放源代码的PHP程序调试器(即一个Debug工具),可以用来跟踪,调试和分析PHP程序的运行状况,极其方便。
安装
最简单的安装方式
这种方式安装后,php.ini自动添加启用扩展。
可用通过
查询是否安装好可扩展。
详情可以参考官方文档。
配置
打开php.ini编辑,如果不知道php.ini在自己电脑哪个位置的,可以执行
1
2
3
4
5
| ➜ php --ini
Configuration File (php.ini) Path: /usr/local/etc/php/7.3
Loaded Configuration File: /usr/local/etc/php/7.3/php.ini
Scan for additional .ini files in: /usr/local/etc/php/7.3/conf.d
Additional .ini files parsed: /usr/local/etc/php/7.3/conf.d/ext-opcache.ini
|
可以看到php.ini的文件全路径了。
将下面的配置,添加到php.ini最后
1
2
3
4
5
6
7
8
9
10
11
12
13
14
15
16
17
18
|
[XDebug]
xdebug.remote_enable = 1
xdebug.profiler_enable = 1
xdebug.remote_host=0.0.0.0
xdebug.profiler_enable_trigger = 1
xdebug.profiler_output_name = cachegrind.out.%t.%p
xdebug.profiler_output_dir = "~/phpxdebug"
xdebug.remote_autostart=1
xdebug.auto_trace=1
xdebug.show_local_vars=0
xdebug.remote_handel=dbgp
xdebug.remote_port=9001
xdebug.idekey="phpxdebug"
|
如果配置了php服务则重启下php服务。
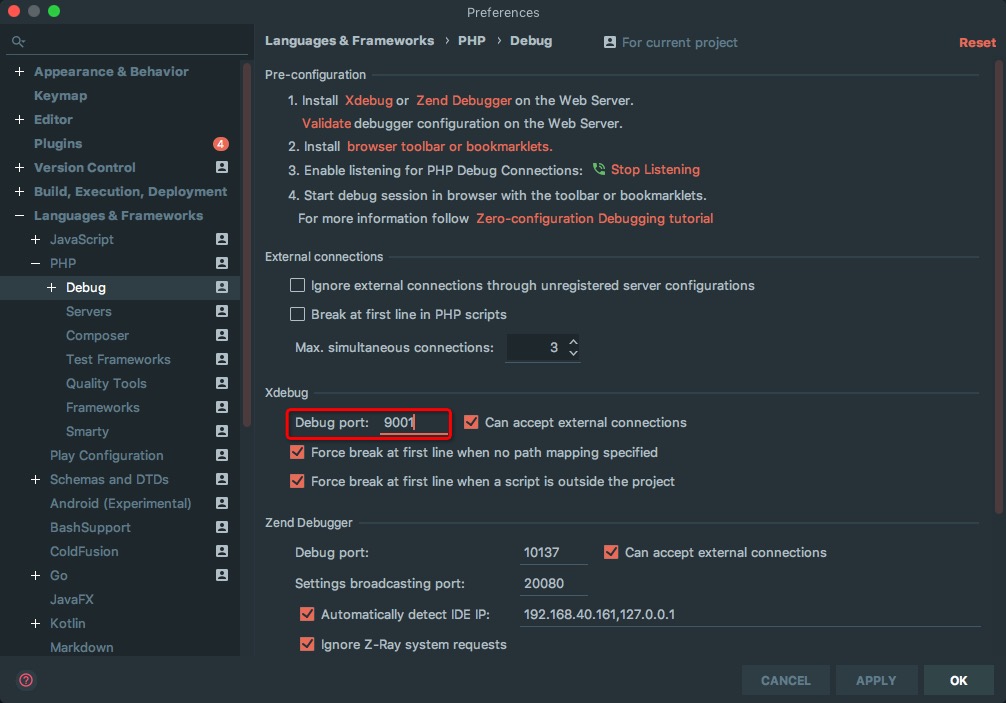
IDE配置
以idea为例,修改下图的配置,端口需改为我们配置的9001
![xdebug-port]()
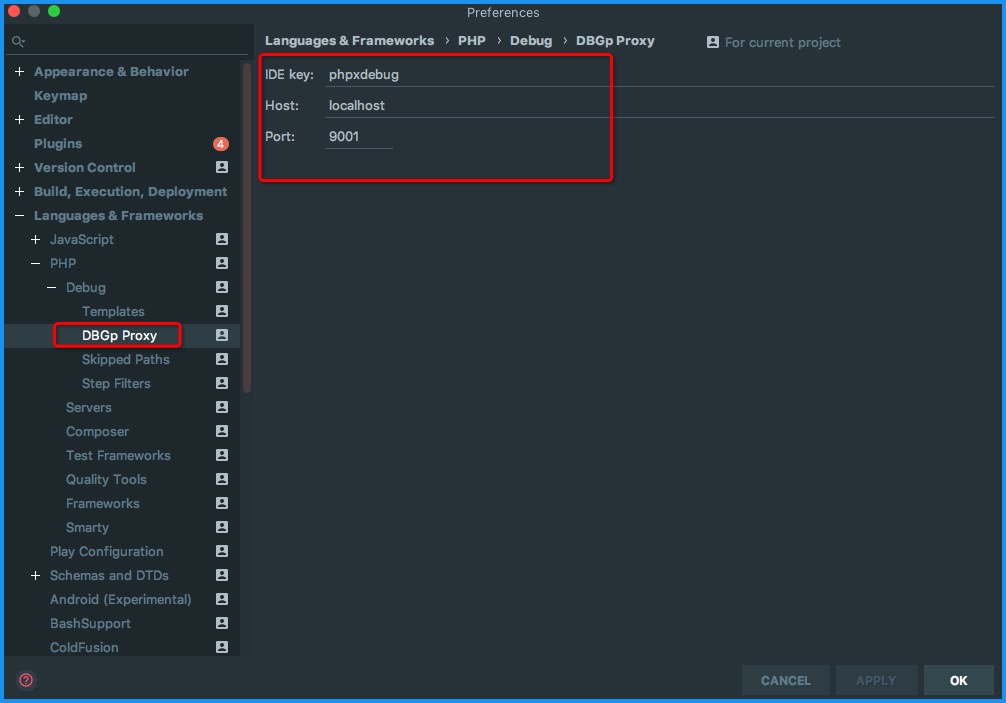
![xdebug-ide-setting]()
记得点击,开始监听调试,图示表示已经在监听。
![xdebug-listening]()
创建文件验证一下
1
2
3
4
5
6
7
8
9
| <?php
$q = new \stdClass();
$q->name = 1;
$b = ["age" => 13];
var_dump((object)array_merge((array)$q, $b));
|
在第7行打一个断点。
![xdebug-dd]()
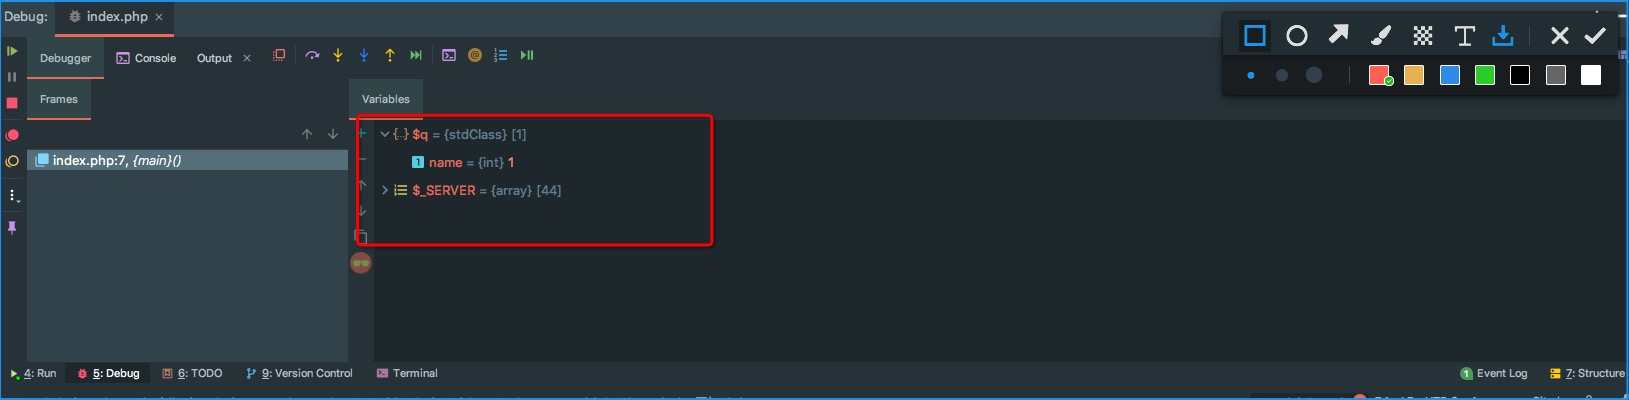
如果IDE弹出Debug窗口,那么xdebug我们已经配置成功,尽情玩耍吧。如图所示
![xdebug-ide-window]()